By Noah Sabatier
In 1983, then-chain smoker Allen Carr experienced a moment of revelation in his life. He realized that his difficulty in quitting smoking didn’t stem from a lack of education on the negatives of smoking. Awareness of the risks and drawbacks of smoking had entered the public realm, but these failed to convince him to quit. Allen realized that his difficulty in quitting came from the belief that he was gaining something positive, such as stress relief, from smoking. Once Allen deconstructed the illusionary benefits of smoking in his mind, he was able not only to quit, but to do so without the feeling that he was losing something valuable or important.
Now, blue light isn’t literally addictive, we don’t get a dopamine surge from seeing white artificial light at night (ALAN) outside our home. What we do get however is a range of illusions and fallacies introduced with the marketing of new technology, specifically high-efficacy sources of white light such as LEDs, Magnetic-Induction, and Metal Halide. These fallacies are so pervasive that they have been unknowingly carried into advocacy for dark skies and healthier lighting. Even those who understand the drawbacks of white light outdoors often fall into the trap of believing in its “benefits”. Often there is a tug of war, many individuals have reasons to transition away from harmful lighting, yet they also have reasons to continue using it.
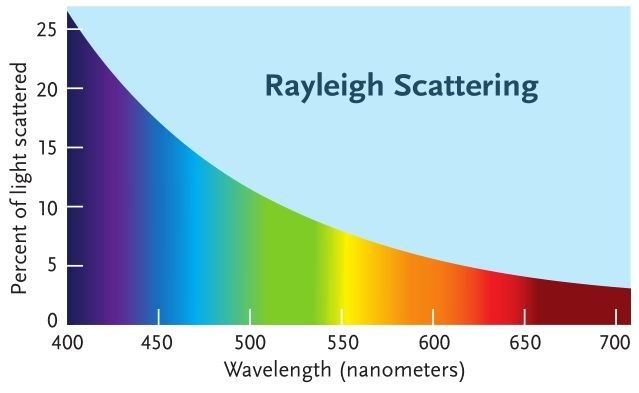
The work of dark sky advocates has succeeded in making many of the ecological harms of light pollution known to the general public. There is also a growing public awareness on a personal scale. An overwhelming majority of those surveyed have testified to being victims of undue glare from LED lighting outdoors. Unsurprisingly, additional surveys have shown preference for light sources that produce less glare through better design and warmer spectral composition. Whether they admit it or not, virtually anyone in a position of power when it comes to lighting policy and implementation has been made aware of the drawbacks of blue-rich outdoor lighting.
The problem that Allen Carr faced in quitting smoking has surfaced within the realm of outdoor lighting. Both the general public, and industry figures, have been made aware of the drawbacks of blue light in outdoor illumination. Across much of the world however, the choice has been made to do nothing to address the issue – why is this? The primary problem isn’t education on the drawbacks of blue light within ALAN, it is the mistaken belief of dependency – the belief that there is something important in having white light outside at night. In order to achieve freedom from poorly designed lighting, we must remove the illusions and fallacies that make poorly-designed lighting seem appealing.
There are 3 primary fallacies to remove in our quest for freedom from bad outdoor lighting, primarily generated during the transition from high-pressure sodium (HPS) lighting to LEDs. The belief that white light improves visual performance and safety, the belief that “brighter” is better, and the belief that white LED streetlights have helped the environment. The first 2 beliefs here have been thoroughly covered in previous articles, so we will summarize their deconstruction here.
The theory that white light improves visual performance and safety over yellow-amber light, such as HPS lamps, is a deeply held belief within the lighting industry. This belief is based on a series of primitive studies in which outdoor lighting was simulated indoors with projectors. Studies using this methodology, such as the Mesopic Optimization of Visual Performance, found that blue light provided benefits in visual performance at the lowest roadway luminance levels. These results were then used to justify the global transition to sources of white light for roadway illumination, primarily LEDs.
Despite the wide acceptance of this paradigm, it is a mere fallacy. For context, 2 classes of cells within our retina provide vision, rods and cones. Blue-sensitive rod cells function at the lowest levels of light in order to provide night vision. Cone cells, which are primarily sensitive to yellow light, function at all but the lowest levels of light. In the world of artificial light at night, the high luminance of light sources prevents rod cells in our retinas from reliably functioning – if at all. Additionally, rod cells take a significant amount of time to regenerate photopigment after exposure to bright light. Neither of these 2 factors were present in the aforementioned studies, preventing them from being applicable to the real world. In real world artificially-illuminated environments we are reliant on yellow-sensitive cone cells for visual performance, not blue-sensitive rod cells.

The next illusion that we need to escape from is the belief that brighter is better. In 2025 it is difficult to find a member of the public that hasn’t suffered from undue glare at night, whether it be LED streetlights or headlights. At the same time however, many of these people praise the perceived brightness of white LED lighting or subconsciously view it as a positive. In order to remove this illusion, it needs to be understood that our perception of brightness is not an indicator of actual light levels. In fact, the perception of brightness represents glare and discomfort in human vision.
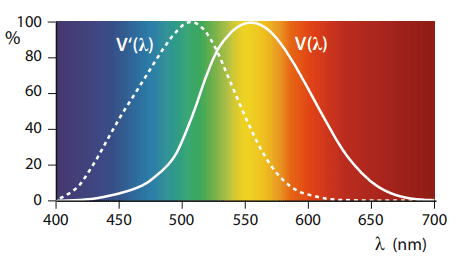
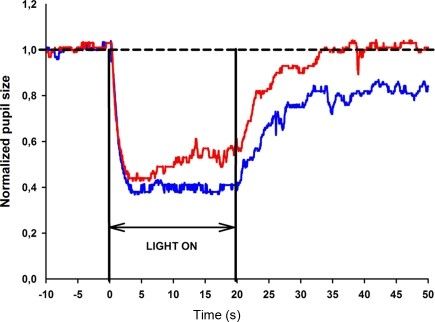
The human perception of brightness is based on a 3rd class of cells within our retina, the non-image-forming photoreceptor (NIFPs). NIFPs are primarily sensitive to blue light, their spectral sensitivity being even bluer than that of rod cells. Notably, the spectral sensitivity of NIFPs is misaligned with the spectral sensitivity of vision-providing cone cells. The misalignment between NIFPs and cone cells is crucial to understand because of the consequences it creates in our world. When perceived brightness is used to rate light sources, the result is achieving increased glare and discomfort – not improved visual performance. It has been documented in studies that white light sources are rated as brighter, and therefore perceived as better, than yellow sources of light even when the white source provided lower luminance levels. Unless we abandon the value of perceived brightness, we will be forever burdened with an attraction to glare-inducing light sources.
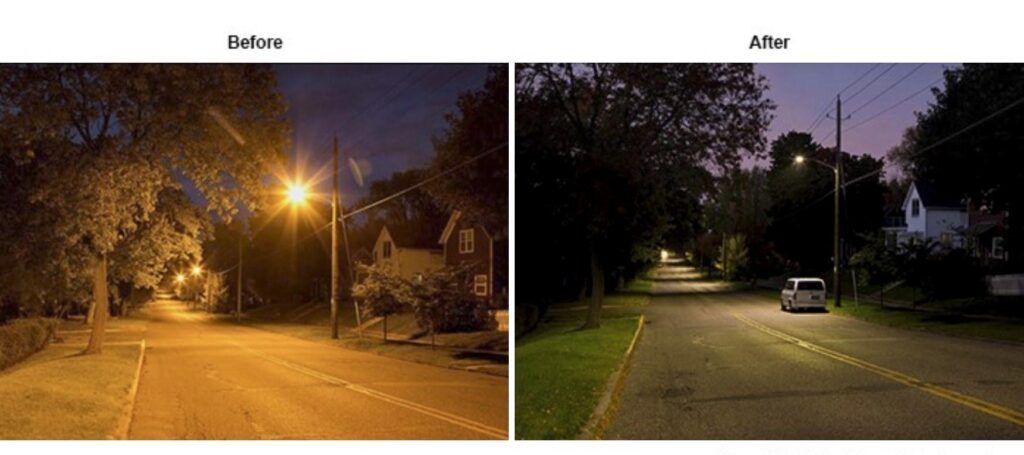
The final fallacy to remove is the illusion that transitioning to white LED roadway lighting has helped the environment. This belief is based on the idea that LED streetlights are more efficient than HPS streetlights, resulting in energy savings. The truth is that the majority of LED streetlight installations are less efficient than HPS lamps, energy savings being achieved through lighting a smaller area to a lower level of luminance. This practice is justified by the 1st belief we deconstructed – that white light improves visual performance and therefore less is needed. This fact is often used in another element of greenwashing, the belief that LEDs are ecologically friendly because they produce less light.
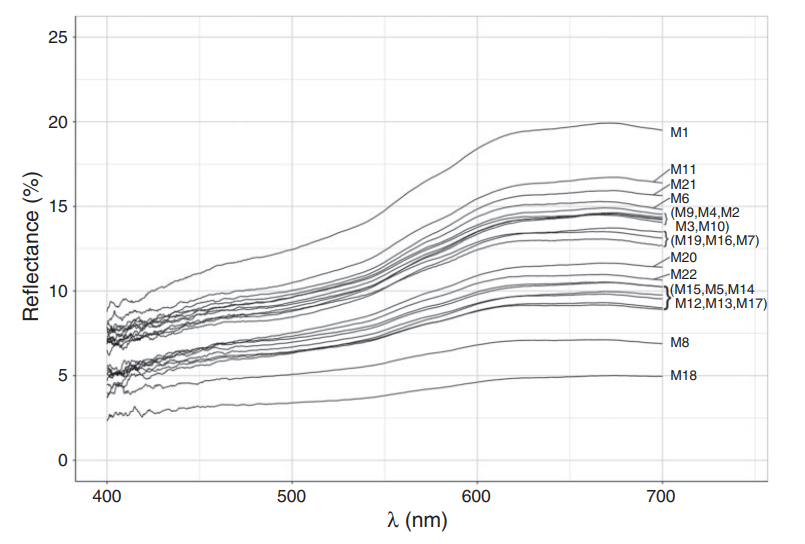
The truth is that the white light produced by typical roadway LEDs is exponentially more toxic for the environment than yellow-amber light. Even in rare cases where transitioning to LED streetlights reduced the volume of light pollution, ecological damage was still greatly increased. Research into the impacts of light pollution on ecosystems has greatly accelerated in recent decades, revealing a growing list of impacts. In the majority of these cases, blue light is the active spectral component for ecological damage from light pollution, primarily through disrupting light-entrained cycles within organisms.

Deconstruction of the 3 beliefs discussed today is crucial to achieving outdoor lighting that provides better visibility, and minimizes ecological damage. Lighting industry members and the general public know that light pollution and glare are worse than ever, yet many have chosen to do nothing. Many people believe that the increased glare from blinding white LEDs is a necessary side effect from “brighter and better” lighting. For this reason, a new effort must be made not only to remind people of the drawbacks of white ALAN, but to enlighten people with the truth that white lighting has no benefits compared to yellow-amber lighting.
To summarize; The transition to white lighting outdoors has reduced safety and visual performance, not improved it. Brighter isn’t better, a light source appearing brighter simply means that it is providing more glare – not better lighting. Finally, the transition to white LED lighting outdoors has not helped the environment – it has greatly harmed it. All of the “benefits” of white outdoor lighting are not only fallacies, but are in fact drawbacks of poor lighting. Remember the tug of war from earlier? The playing field has now changed, giving us 3 more reasons to move on from harmful white ALAN and 0 reasons to continue using it.
Noah Sabatier is a photographer and lighting researcher that is dedicated to advocating for better outdoor lighting. Noah has spent the past 5 years living with a night shift sleep schedule, during this time he realized that the streetlights in his city were far from optimal – and recent changes had only made them worse. He has spent the past 2 years extensively reviewing scientific literature and technical documents alongside others advocating for better lighting. Noah is now working to raise awareness of common misconceptions that lead to bad lighting and the better practices needed to solve this problem.
Reach him at: noahsabatierphoto[at]gmail.com
Works Cited:
Goodman T, Forbes A, Walkey H, et al. Mesopic visual efficiency IV: a model with relevance to nighttime driving and other applications. Lighting Research & Technology. 2007;39(4):365-392.
Uchida T, Ayama M, Akashi Y, et al. Adaptation luminance simulation for CIE mesopic photometry system implementation. Lighting Research & Technology. 2016;48(1):14-25
Bommel, W. Road Lighting. Fundamentals, Technology and Application; Springer: Berlin/Heidelberg, Germany, 2015. Doi: 10.1007/978-3-319-11466-8
Suzuki Y, Minami T, Laeng B, Nakauchi S. Colorful glares: Effects of colors on brightness illusions measured with pupillometry. Acta Psychol (Amst). 2019 Jul;198:102882. doi: 10.1016/j.actpsy.2019.102882. Epub 2019 Jul 6. PMID: 31288107.
Kristen J. Navara, Randy J. Nelson. The dark side of light at night: physiological, epidemiological, and ecological consequences J. Pineal Res. 2007; 43:215–224
Dominoni, D.M. and Nelson, R.J. (2018), Artificial light at night as an environmental pollutant: An integrative approach across taxa, biological functions, and scientific disciplines. J. Exp. Zool., 329: 387-393.
RAC Headlight Glare Survey Study
L.M. Geerdinck, J.R. Van Gheluwe, M.C.J.M. Vissenberg, Discomfort glare perception of non-uniform light sources in an office setting, Journal of Environmental Psychology, Volume 39, 2014, Pages 5-13, ISSN 0272-4944, https://doi.org/10.1016/j.jenvp.2014.04.002.